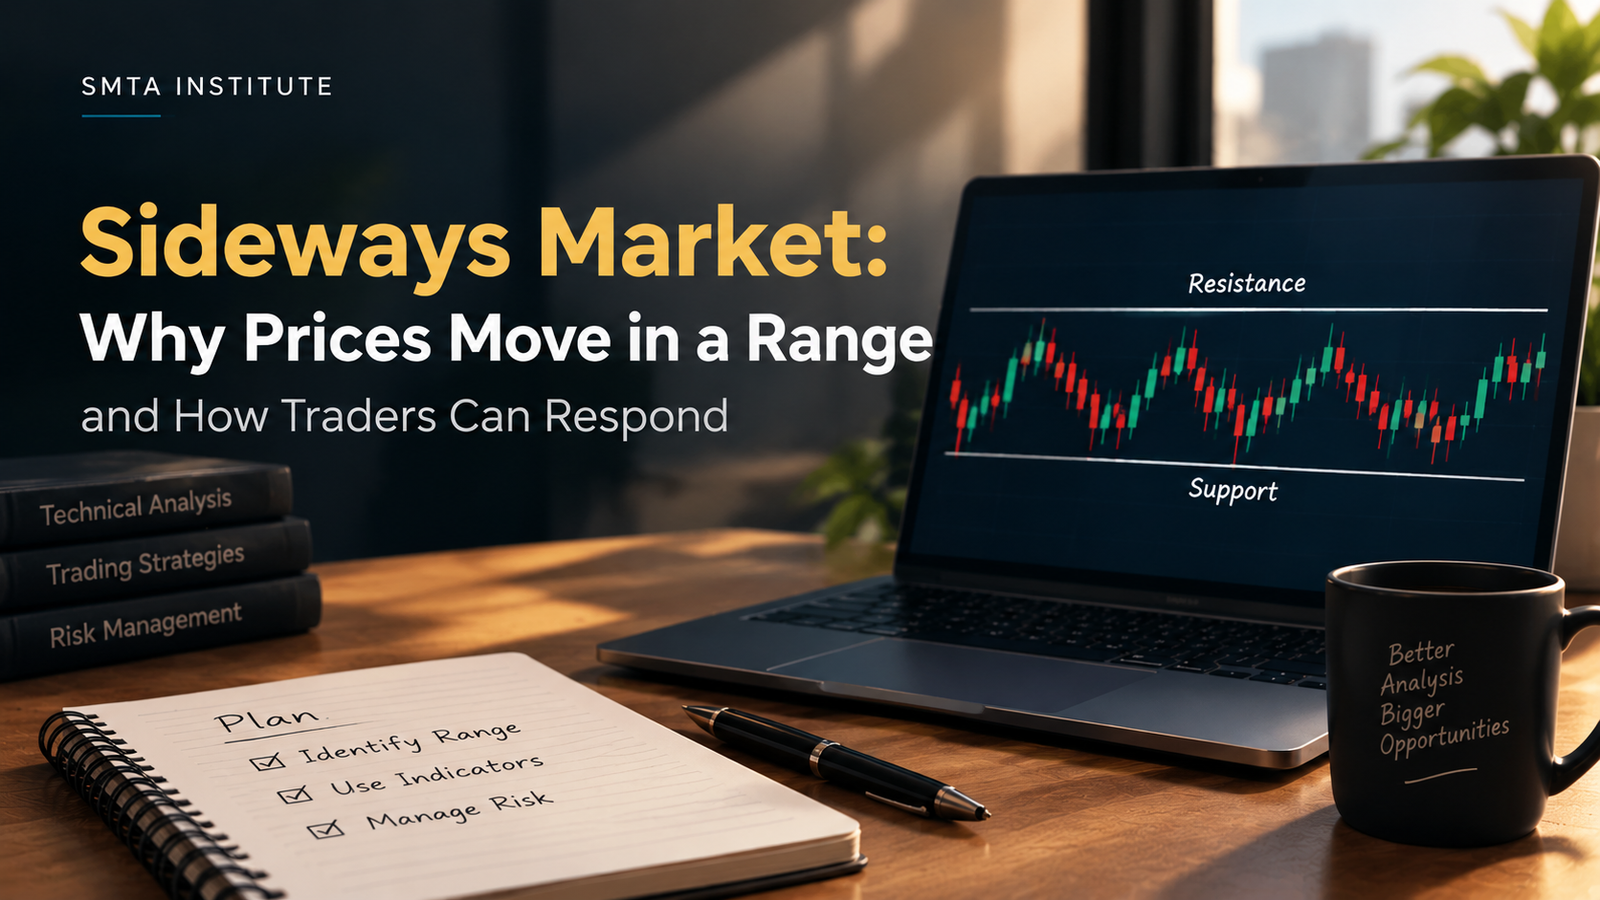

Have you ever noticed a stock moving up and down throughout the trading session, only to end up almost where it started? You wait for a breakout, expect a strong rally, or anticipate a fall, but the price continues moving within the same range. This is a common situation in the stock market, and it is known as a sideways market.
A sideways market can be challenging, especially for traders who depend on strong price movements to identify trading opportunities. However, understanding why markets move sideways and how to recognise these conditions can help traders make more informed decisions instead of reacting to every price fluctuation.
What Is a Sideways Market?
A sideways market occurs when the price of a stock, index, or other financial instrument moves within a relatively defined range without establishing a clear upward or downward trend.
In a bullish market, prices generally move higher, while a bearish market is characterised by declining prices. A sideways market, on the other hand, reflects a period of consolidation in which buying and selling pressure remain relatively balanced.
For example, if the Nifty 50 repeatedly moves between two price levels without sustaining a move beyond either boundary, the market may be trading sideways. These conditions can last for a few trading sessions or continue for several weeks.
A sideways market is also known as a range-bound market. Recognising this phase is important because a strategy that works well during a strong trend may not produce the same results when prices lack clear direction.
Why Does the Stock Market Move Sideways?
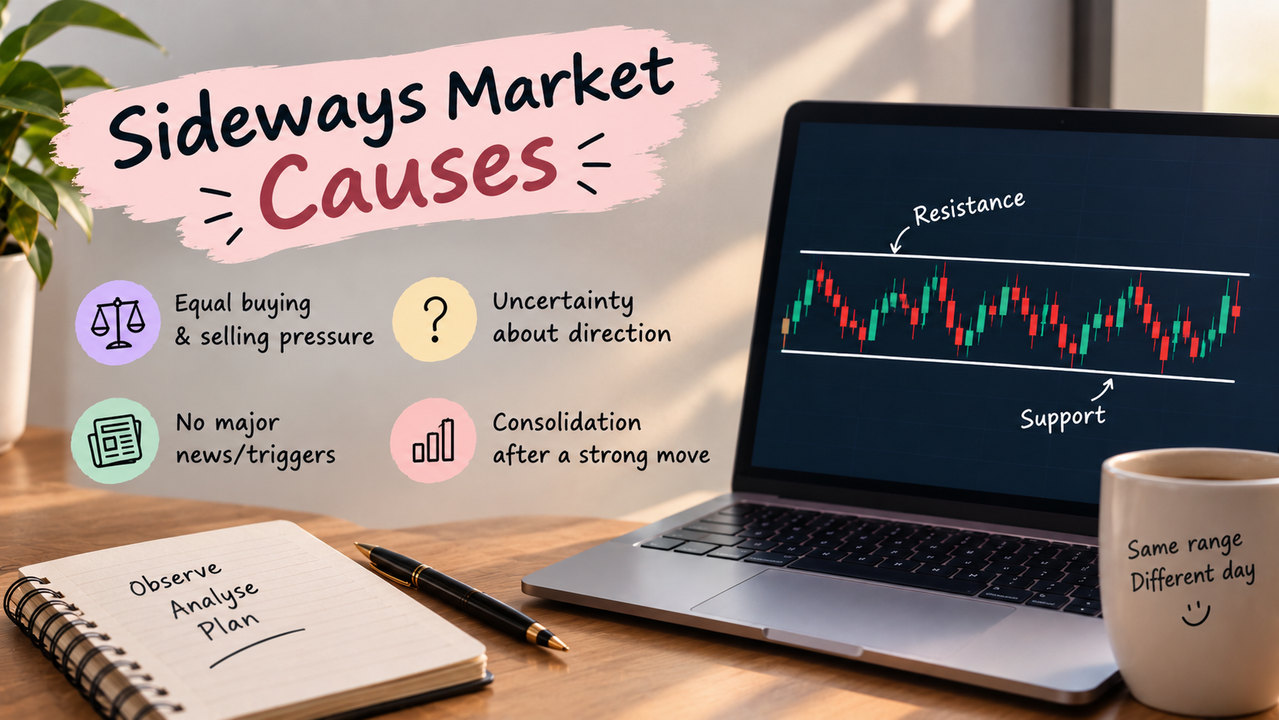
Market prices do not move in one direction all the time. Several factors can contribute to a sideways market.
1. Balance Between Buyers and Sellers
When buying and selling pressure remains relatively equal, neither side gains enough strength to establish a sustained trend. As a result, prices fluctuate within a particular range.
2. Uncertainty About Market Direction
Traders and investors may hesitate to take positions when economic conditions, corporate earnings, or global market developments create uncertainty. This hesitation can reduce directional momentum.
3. Lack of Major Market Triggers
Important events such as interest rate decisions, inflation data, and company earnings can influence market movements. When significant triggers are absent, prices may consolidate rather than move strongly in either direction.
4. Consolidation After a Strong Move
After a substantial rally or decline, the market may pause as participants reassess their positions. This consolidation phase can develop into a sideways market before the next significant move.
How to Identify a Sideways Market
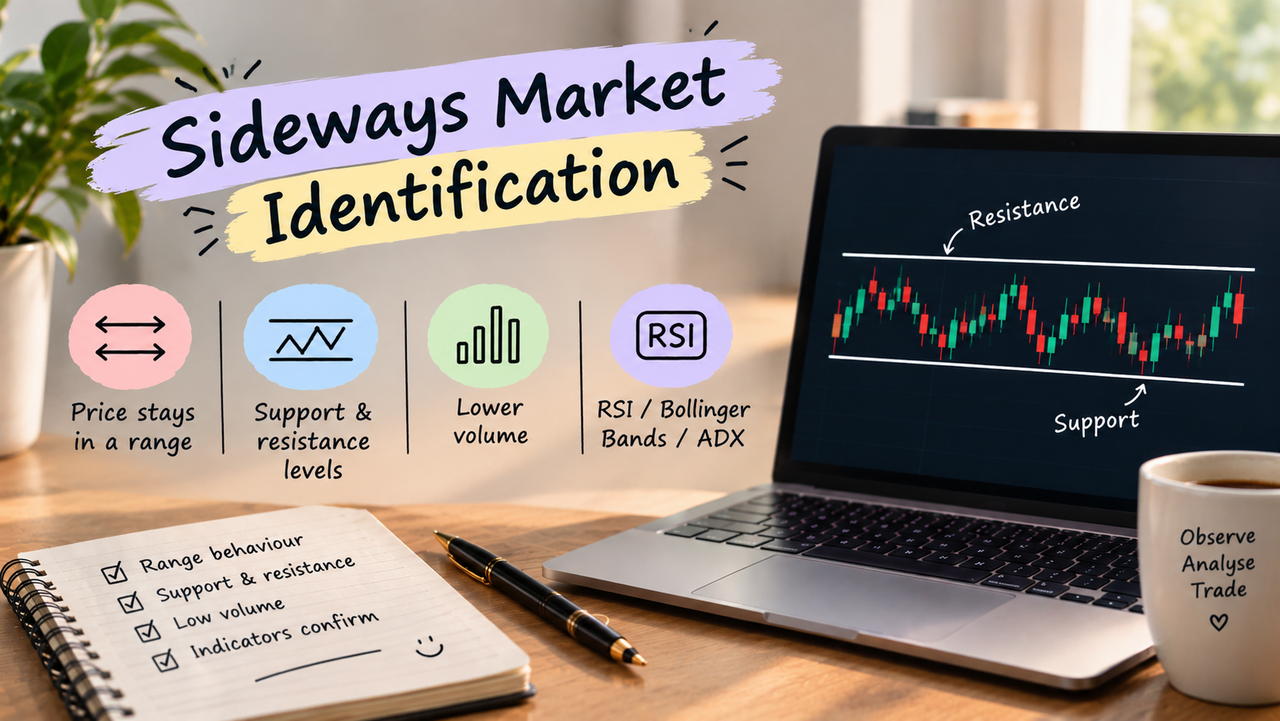
Identifying a sideways market requires more than observing a stock that has not moved much during a single session. Traders need to study price behaviour over a suitable period.
One of the most useful methods is identifying support and resistance levels. Support is a price area where buying interest may emerge, while resistance is an area where selling pressure may increase. When prices repeatedly move between these levels, the market may be range-bound.
Technical indicators can provide additional insights. The Relative Strength Index (RSI) helps traders assess momentum, while Bollinger Bands can highlight changes in volatility. The Average Directional Index (ADX) can also help evaluate trend strength.
However, no single indicator confirms every sideways market. Traders should combine technical indicators with price action, trading volume, and the broader market context.
Trading Strategies for a Sideways Market
Trading in a sideways market requires patience because prices may produce several false signals before establishing a clear direction.
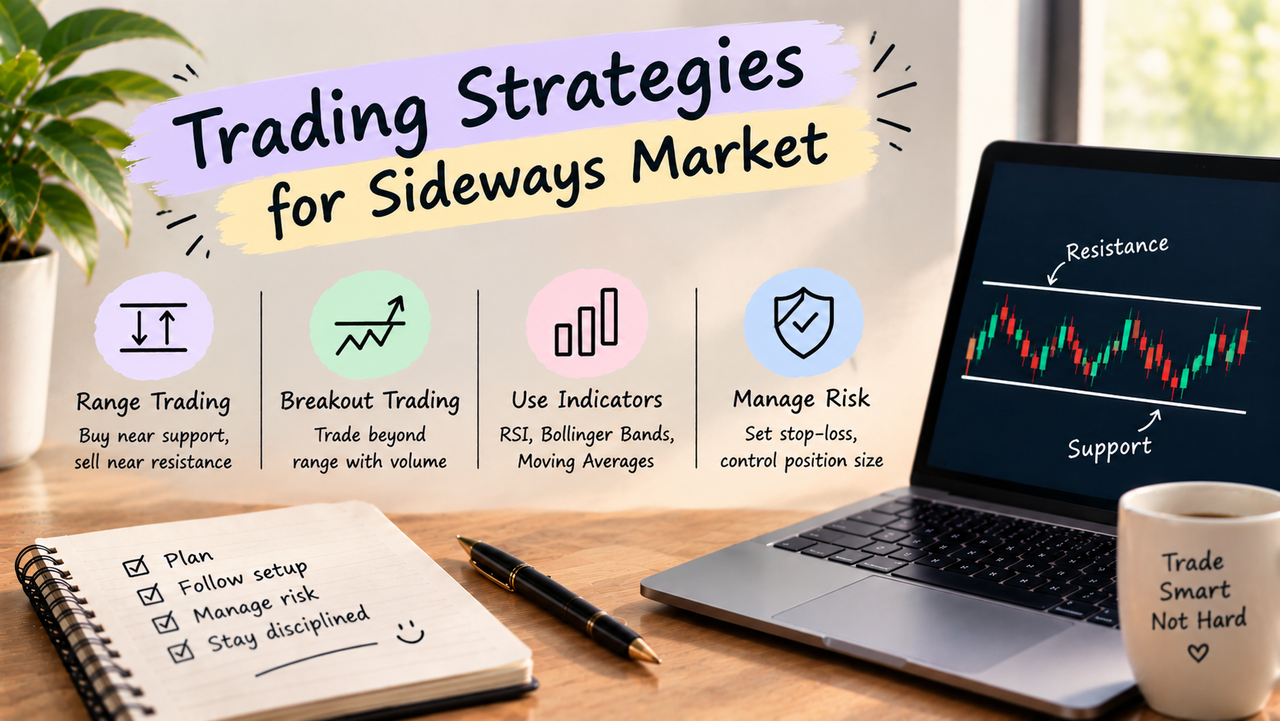
Range Trading
Traders identify support and resistance zones and look for potential opportunities near the boundaries of the range. However, these levels can break unexpectedly, so risk management remains essential.
Breakout Trading
Some traders wait for prices to move beyond the established range. A breakout supported by increased trading volume may provide additional confirmation, although false breakouts are still possible.
Using Technical Indicators
RSI, Bollinger Bands, and moving averages can help traders evaluate momentum and volatility. These tools are most useful when interpreted alongside price action rather than in isolation.
Maintaining Risk Discipline
Setting suitable stop-loss levels, controlling position sizes, and avoiding unnecessary trades can help traders manage risk during uncertain market conditions.
No strategy guarantees profits. The appropriate approach depends on the instrument being traded, prevailing market conditions, and the trader's risk tolerance.
Common Mistakes Traders Should Avoid
One common mistake is assuming that prices will always reverse when they reach support or resistance. A market that has been moving sideways can suddenly break out because of unexpected news or a change in market sentiment.
Another mistake is taking repeated trades simply because the market appears predictable. Frequent entries without a clear setup can increase transaction costs and expose traders to unnecessary losses.
Ignoring broader market trends is also risky. A stock may appear range-bound while the overall market is preparing for a significant move. Analysing multiple factors can help traders avoid making decisions based on incomplete information.
Build Your Technical Analysis Skills with SMTA Institute
Understanding different market conditions is an important part of learning stock market trading. Traders need to recognise trends, interpret price charts, identify support and resistance, and understand the limitations of technical indicators.
At SMTA Institute, learners can explore stock market concepts and technical analysis to develop a stronger foundation in trading. Building knowledge of chart patterns, market behaviour, and risk management can help aspiring traders approach different market situations with greater clarity.
The objective is not to predict every market movement but to understand how prices behave and evaluate trading opportunities through a structured approach.
A sideways market is a normal part of stock market behaviour, characterised by prices moving within a range rather than following a clear trend. Although these conditions can make trading challenging, recognising support and resistance levels, understanding technical indicators, and following disciplined risk management practices can help traders assess potential opportunities more effectively.
Successful market analysis begins with understanding the conditions in which you are trading. Whether the market is bullish, bearish, or sideways, patience and a well-defined trading plan remain essential.